Varnishlog: measure your Varnish cache performance
Varnish sits in front of the web server or application server and caches its output. As a result, the logs of the web server no longer paint a complete picture of your site’s traffic.
Although cache misses and cache bypass still appear in the logs, there is a need for logging on the edge. And that’s where varnishlog comes into play. Not just as a replacement for your web server logs, but also as a powertool to perform in-depth analysis of your requests, responses, backend fetches, backend health and caching behavior.
The Varnish Shared Memory Log
The varnishd process reserves shared memory for logging by creating and mapping files in a tmpfs memory file system. The files are subsequently mapped by log consumers like varnishlog, varnishncsa, and varnishstat in read-only mode, allowing them to get information and logs from varnishd without affecting the caching process. These files are collectively know as Varnish Shared Memory (VSM). The part of the VSM responsible for communicating information about the traffic flowing through Varnish is called the Varnish Shared Memory Log (VSL).
tmpfs volume to get the expected performance.The VSL is a circular buffer with a default size of 80 MB, but the size can be changed through the vsl_space runtime parameter.
-l option of varnishd is shorthand for -p vsl_space=The varnishlog program
The varnishlog program is a utility that comes with any Varnish installation. It reads from the varnishd shared memory logs and returns very verbose multi-line output.
Here’s a small extract of some varnishlog output:
*   << Session  >> 32780
-   Begin          sess 0 HTTP/1
-   Link           req 32781 rxreq
**  << Request  >> 32781
--  Begin          req 32780 rxreq
--  ReqURL         /
--  VCL_call       RECV
--  VCL_return     hash
--  VCL_call       HASH
--  VCL_return     lookup
--  VCL_call       MISS
--  VCL_return     fetch
--  Link           bereq 32782 fetch
--  RespStatus     200
--  RespReason     OK
--  VCL_call       DELIVER
--  VCL_return     deliver
*** << BeReq    >> 32782
--- Begin          bereq 32781 fetch
--- VCL_use        boot
--- BereqURL       /
--- VCL_call       BACKEND_FETCH
--- VCL_return     fetch
--- BerespStatus   200
--- BerespReason   OK
--- VCL_call       BACKEND_RESPONSE
--- VCL_return     deliver
The output features multiple logging transactions, each identified by a numeric transaction id. In this case there are 3 transactions:
- Transaction
32780for the HTTP session (including the connection) - Transaction
32781for the incoming HTTP request and subsequent response - Transaction
32782for the backend fetch to the origin server (because the response wasn’t found in the cache)
Each transaction has a set of log lines and each log line has a tag and a value. Each value can have multiple attributes.
The Begin tag is used to mark the start of the transaction and refers to the parent transaction ID, whereas the Link tag links to a subordinate transaction.
The output contains request information, like the request URL and some response information, like the response status code and reason.
Even the execution of the finite State Machine appears in this varnishlog extract. It shows that the request resulted in a cache miss, which triggered a backend fetch.
varnishlog output. An actual transaction would contain a lot more log lines. Throughout this tutorial we will cover the various tags that appear in the log lines and ways to filter the output.varnishncsa.varnishlog options
The varnishlog program has quite a number of command line options. Here’s the complete list:
Options:
 [-a]                      Append to file
 [-A]                      Text output
 [-b]                      Only display backend records
 [-c]                      Only display client records
 [-C]                      Caseless regular expressions
 [-d]                      Process old log entries and exit
 [-D]                      Daemonize
 [-g <session|request|vxid|raw>] Grouping mode (default: vxid)
 [-h]                      Usage help
 [-i <taglist>]            Include tags
 [-I <[taglist:]regex>]    Include by regex
 [-k <num>]                Limit transactions
 [-L <limit>]              Incomplete transaction limit
 [-n <dir>]                varnishd working directory
 [-P <file>]               PID file
 [-q <query>]              VSL query
 [-r <filename>]           Binary file input
 [-R <limit[/duration]>]   Output rate limit
 [-t <seconds|off>]        VSM connection timeout
 [-T <seconds>]            Transaction end timeout
 [-v]                      Verbose record printing
 [-V]                      Version
 [-w <filename>]           Output filename
 [-x <taglist>]            Exclude tags
 [-X <[taglist:]regex>]    Exclude by regex
Reducing output
When it comes to filtering output, the -i, -I, -x and -X options would be the ones to use. They allow you to include or exclude log lines for specific tags, basically reducing the output.
Where -i and -x are there to respectively include or exclude lines based on the name of a tag, the -I and -X include and exclude tags based on regular expression patterns that match the value for these tags.
The -q option can be used to specify a VSL query. The output will only contain transactions that match the query.
The -R option performs rate limiting on the output only returning transactions on a limit/duration basis. This is especially useful for very busy systems.
Transaction-related options
The execution of the finite State Machine uses a variety transactions which typically run in a separate thread.
There is a session transaction when a connection is made, a request transaction when a request is received, and a backend request transaction when fetches to the backend are made. When Edge Side Includes are used, ESI subrequests are issued, which could also result in their own backend requests. These are also separate transactions.
The -g command line options sets the grouping mode of log lines. The default value is vxid and groups logs by transaction ID. Other grouping options include session, request and raw.
The -c and -b options allow you to only include either client-side transactions or backend-side transactions. By default you get both.
Reading and writing from the disk
varnishlog output is typically sent to the standard output. Using the -w option you can write the binary output to a file. Here’s an example:
varnishlog -w vsl.log
This example will write VSL output in binary format to the vsl.log file and overwrite any existing content in that file.
If you want to append to the file, rather than overwriting the content, you can add the -a option:
varnishlog -a -w vsl.log
Reading the output from a binary VSL log can be done by using the -r option, as illustrated in the example below:
varnishlog -r vsl.log
If you want to store the log output in ASCII format, just add the -A option. Here’s an example where we append content to vsl.log in a human-readable format:
varnishlog -a -A -w vsl.log
Transactions
VSL keeps track of transactions. Each transaction contains a number of log lines and is identified by a transaction identifier, which we call the VXID.
Transactions are either sessions or requests:
- A session represents the TCP connection between the client and Varnish.
- A request is any HTTP request that involves Varnish.
There are different kinds of request transactions:
- The client request to Varnish
- The backend request from Varnish to the origin
- An ESI subrequest from Varnish to the origin
Transaction hierarchy
There is a hierarchy between transactions, which is illustrated in the diagram below:
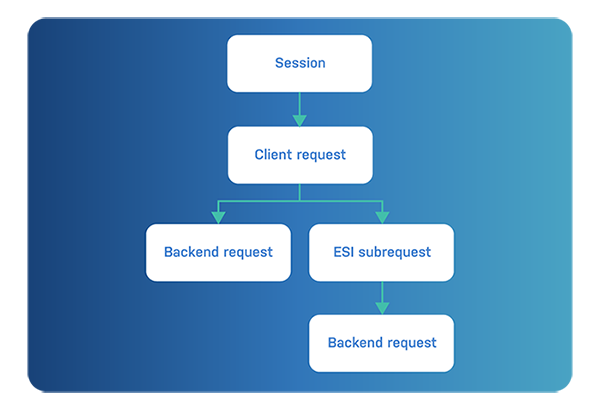
- The session is the top-level transaction.
- A session can have multiple requests.
- Non-cached objects will result in backend requests.
- Backend responses may include ESI tags. When parsed, they result in ESI subrequests.
- Non-cached ESI responses may result in corresponding backend requests.
Here’s what that looks like in terms of VSL when we run varnishlog -i Begin:
*   << BeReq    >> 3
-   Begin          bereq 2 fetch

*   << BeReq    >> 5
-   Begin          bereq 4 fetch

*   << Request  >> 4
-   Begin          req 2 esi

*   << Request  >> 2
-   Begin          req 1 rxreq

*   << Session  >> 1
-   Begin          sess 0 HTTP/1
The Begin tag is used at the start of each transaction.
The first << BeReq >> transaction has VXID 3. The Begin tag for this transaction indicates that this is a regular fetch that was initiated by VXID 2.
The second << BeReq >> transaction has VXID 5. The Begin tag for this transaction indicates that this is a regular fetch that was initiated by VXID 4.
The first << Request >> transaction is identified by VXID 4, and its Begin tag is an ESI subrequest that was initiated by VXID 2.
The second << Request >> transaction is identified by VXID 2, and its Begin tag is a regular request that was initiated by VXID 1.
The << Session >> transaction is identified by VXID 1 and opens up a connection for HTTP/1.1 traffic. It doesn’t depend on any other transaction, hence the reference to VXID 0.
Transaction grouping
Transactions can be grouped, and the type of grouping that is used will influence the order of the transactions.
By default transactions are displayed in the order in which they complete, which at first glance looks like the reverse order and can seem puzzling.
Here’s another diagram that should illustrate this effect:

In this simple example, the backend request, identified by VXID 3, is the only transaction that doesn’t depend on another and is displayed first.
The request, identified by VXID 2, can only complete after the backend transaction and will be displayed next.
And finally the session, identified by VXID 1, is displayed because it was waiting for the client request to complete.
You can choose the following grouping modes to change the order:
vxid(default)sessionrequestraw
This is our VSL output grouped by session when we run varnishlog -g session -i Begin:
*   << Session  >> 1
-   Begin          sess 0 HTTP/1
**  << Request  >> 2
--  Begin          req 1 rxreq
*** << BeReq    >> 3
--- Begin          bereq 2 fetch
*** << Request  >> 4
--- Begin          req 2 esi
*4* << BeReq    >> 5
-4- Begin          bereq 4 fetch
As you can see, the order is more intuitive, and there’s a level of indentation.
In situations where you primarily care about requests and not about session information, you can group by request and omit the session transaction.
Here’s what that looks like when we run varnishlog -g request -i Begin:
*   << Request  >> 2
-   Begin          req 1 rxreq
**  << BeReq    >> 3
--  Begin          bereq 2 fetch
**  << Request  >> 4
--  Begin          req 2 esi
*** << BeReq    >> 5
--- Begin          bereq 4 fetch
You can see that VXID 1 is no longer included and that VXID 2 is not the top-level transaction. And the indentation remained.
As far as raw grouping goes, here’s some example output when we run varnishlog -g raw:
 1 Begin          c sess 0 HTTP/1
 3 Begin          b bereq 2 fetch
 5 Begin          b bereq 4 fetch
 4 Begin          c req 2 esi
 2 Begin          c req 1 rxreq
As you can see, the log lines are no longer grouped in transactions. They are displayed as they are received. As soon as some production traffic hits your Varnish server, raw grouping becomes nearly impossible to use.
However, raw grouping still has its purpose and is also the only way to collect non-transactional logs, logs that aren’t tied to a session, request or backend request task. Non-transactional logs have the VXID 0 to reflect the absence of a transaction ID.
Here’s the output of varnishlog -g raw in a situation where there are no incoming requests:
0 CLI            - Rd ping
0 CLI            - Wr 200 19 PONG 1691745227 1.0
0 Backend_health - boot.default Still healthy 4---X-RH 8 3 8 0.004862 0.003716 HTTP/1.1 200 OK
This output features CLI tags that log CLI communication between the varnishd master and child process. You can see a ping being sent and a PONG being received.
The output also features a Backend_health tag that logs the result of a health probe that is defined in the VCL file. This probe sends an HTTP request to a pre-defined endpoint and expects a 200 OK status to be considered healthy.
Tags
Each VSL transaction contains a number of log lines. Each line has a tag and that tag has a corresponding value.
In previous examples we’ve limited ourselves to the Begin tag to indicate the beginning of each transaction. But there are a lot more tags that can be displayed in the VSL output.
Transaction tags
Here’s the list of transaction-related tags:
Begin: marks the start of an VXID transactionEnd: marks the end of an VXID transactionLink: links to a child VXID transaction
And here’s an example where these tags are used:
*   << Request  >> 2
-   Begin          req 1 rxreq
-   Link           bereq 3 fetch
-   End
**  << BeReq    >> 3
--  Begin          bereq 2 fetch
--  End
This is the format of the Begin tag:
%s %d %s
|  |  |
|  |  +- Reason
|  +---- Parent vxid
+------- Type ("sess", "req" or "bereq")
As you can see it starts with either sess, req, or bereq to indicate the type of transaction. The reason field clearly indicates why or how this transaction is taking place.
The Link tag is also quite useful, as it shows what kind of child transaction is initiated from the current one.
Here’s the format:
%s %d %s
|  |  |
|  |  +- Reason
|  +---- Child vxid
+------- Child type ("req" or "bereq")
A transaction can either trigger a (sub-)request, or a backend request. Hence the types req and bereq. The Link tag will also display the VXID of the child transaction. And finally, the reason why this happens is displayed.
Session tags
SessOpen: displays the socket endpoints when a client connection has been openedSessClose: displays the reason for the socket closure and the duration of the session
Here’s an example where these two tags are used within a session transaction:
*   << Session  >> 1
-   SessOpen       127.0.0.1 51726 a0 127.0.0.1 80 1606299467.161264 19
-   SessClose      REM_CLOSE 0.004
In order to understand what the values of SessOpen are, here’s the format for this tag:
%s %d %s %s %s %f %d
|  |  |  |  |  |   |
|  |  |  |  |  |   +- File descriptor number
|  |  |  |  |  +----- Session start time (unix epoch)
|  |  |  |  +-------- Local TCP port
|  |  |  +----------- Local IPv4/6 address
|  |  +-------------- Socket name (from -a argument)
|  +----------------- Remote TCP port
+-------------------- Remote IPv4/6 address
So let’s explain the meaning of the values from the example:
127.0.0.1is the IP address of the client.51726is the port number of the client.a0is the name of our socket. Because we didn’t name the socket via the-astartup parameter invarnishd, the namea0was automatically assigned.127.0.0.1is also the IP address of the server.80is the port number of the server. This indicates regular HTTP traffic.1606299467.161264is the epoch equivalent ofWednesday, November 25, 2020 10:17:47.161 AM.19is the file descriptor number.
And from the SessClose tag we can determine that the session was closed normally and lasted four milliseconds.
Request tags
The most commonly used VSL tags are request tags. They refer to the HTTP request that is made by the client.
Here’s an overview of these tags:
ReqStart: the start of request processingReqMethod: the HTTP method used to perform the requestReqURL: the URL that is addressed by the requestReqProtocol: the HTTP version used by the requestReqHeader: a set of request headers that were passedReqAcct: the byte counts for the request handling
Here’s an example that features these tags:
-   ReqStart       127.0.0.1 51726 a0
-   ReqMethod      GET
-   ReqURL         /
-   ReqProtocol    HTTP/1.1
-   ReqHeader      Host: localhost
-   ReqHeader      User-Agent: curl/7.64.0
-   ReqHeader      Accept: */*
-   ReqHeader      X-Forwarded-For: 127.0.0.1
-   ReqAcct        73 0 73 268 540 808
The ReqStart tag lets us know what the IP address and port number of the client is. The a0 refers to the socket that was used to connect. This socket is defined using the -a startup parameter.
The ReqMethod tag indicates a regular HTTP GET request, and the ReqURL shows that this request happened on the / URL.
The HTTP protocol version for this request was HTTP/1.1, as indicated by the ReqProtocol tag.
A set of ReqHeader tags are used to list the request headers that were passed with this HTTP request.
Finally, the ReqAcct tag is there to provide request accounting information. Here’s the format of this tag, which will allow us to explain the meaning of ReqAcct from our example:
%d %d %d %d %d %d
|  |  |  |  |  |
|  |  |  |  |  +- Total bytes transmitted
|  |  |  |  +---- Body bytes transmitted
|  |  |  +------- Header bytes transmitted
|  |  +---------- Total bytes received
|  +------------- Body bytes received
+---------------- Header bytes received
What this means in our example is that the incoming request contained 73 bytes of request headers, and no request body, which results in a total incoming byte count of 73 bytes.
The response contained 268 bytes of response header data, and 540 bytes of body payload. This body payload size will also be reflected in the Content-Length response header.
The total number of transmitted bytes is 808.
Response tags
Whenever there’s an HTTP request, there must an HTTP response. The response tags are responsible for displaying information about the HTTP response that was generated by Varnish.
Here’s the list of response tags:
RespProtocol: the HTTP version that is used in the responseRespStatus: the HTTP response status code of the responseRespReason: the response-reason phrase that clarifies the statusRespHeader: a set of response headers that were returned
Here’s a short example of a response containing the response tags that were mentioned:
-   RespProtocol   HTTP/1.1
-   RespStatus     200
-   RespReason     OK
-   RespHeader     Content-Type: text/html
-   RespHeader     Content-Encoding: gzip
-   RespHeader     X-Varnish: 2
-   RespHeader     Age: 1000
We know the response was made using the HTTP/1.1 protocol, as indicated in by the RespProtocol tag. The response was a regular 200 OK. The RespStatus and RespReason will return this information. And finally, there is a set of RespHeader tags that contains the HTTP response headers that were returned.
In this case two response headers were injected by Varnish:
Age: how long the object has been in cacheX-Varnish: the VXID of the transaction
Backend tags
The backend tags are used when a miss or pass occurs, and a connection needs to be established with the origin server.
Here’s an example:
-   BackendOpen    31 boot.default 172.22.0.2 8080 172.22.0.3 45378
-   BackendStart   172.22.0.2 8080
-   BackendClose   31 boot.default
The BackendOpen tag provides information about the TCP or UDS connection that is established with the backend. Here’s the format of the tag:
%d %s %s %s %s %s
|  |  |  |  |  |
|  |  |  |  |  +- Local port
|  |  |  |  +---- Local address
|  |  |  +------- Remote port
|  |  +---------- Remote address
|  +------------- Backend display name
+---------------- Connection file descriptor
In our example file descriptor 31 is used for the backend, and the actual backend that was selected came from a VCL configuration named boot. Inside that VCL configuration a backend named default was used.
You’ll agree that this is a very standard situation.
The connection with the origin was made via IP address 172.22.0.2 on port 8080. The connection originated from IP address 172.22.0.3, and the source port was 45378. The BackendStart tag provides similar information and doesn’t add that much value.
However, it is interesting to see that a BackendClose tag was found. This means the connection was not recycled for future requests to this backend.
If keep-alive was enabled, the origin would return a Connection: Keep-Alive header, and Varnish would reuse that connection. This would result in the BackendReuse tag to appear in VSL, as illustrated below:
- BackendReuse 31 boot.default
Backend request tags
When a backend is opened, the goal is the send a backend request. The backend request tags are there to provide information about the backend request.
In most cases, the backend request will be identical to the client request. However, VCL does allow you to change request information, which might be reflected in the backend request.
These are the backend request tags:
BereqMethodBereqURLBereqProtocolBereqHeaderBereqAcct
This probably needs further explanation.
Backend response tags
Just like regular response tags, there are also backend response tags. These are displayed when the response wasn’t served from cache but required a backend request.
These are the tags, and they look very similar to regular response tags:
BerespProtocolBerespStatusBerespReasonBerespHeader
Again, this needs further explanation.
Object tags
Once a backend response is stored in the cache, it is considered an object and the response properties can be view in VSL using object tags. Here’s the list of object tags:
ObjProtocolObjStatusObjReasonObjHeader
VCL tags
As the Varnish execution flow moves through the various stages of the finite state machine, VCL tags can be used to inspect the flow.
Here’s an overview of the various VCL tags in VSL:
VCL_Error: returns the error message in case of a VCL execution failureVCL_Log: custom log messages that were logged viastd.log()in VCLVCL_acl: evaluation of ACLs in VCLVCL_call: the name of the VCL state that is currently being executedVCL_return: the return statement that was used to transition to the next stateVCL_use: the name of the VCL configuration that is being used
Here’s an example containing some VCL tags:
*   << Request  >> 2
-   VCL_call       RECV
-   VCL_return     hash
-   VCL_call       HASH
-   VCL_return     lookup
-   VCL_call       MISS
-   VCL_return     fetch
-   Link           bereq 3 fetch
-   VCL_call       DELIVER
-   VCL_return     deliver
**  << BeReq    >> 3
--  VCL_use        boot
--  VCL_call       BACKEND_FETCH
--  VCL_return     fetch
--  VCL_call       BACKEND_RESPONSE
--  VCL_return     deliver
This log extract represents a cache miss. The VCL_call tags go from RECV, to HASH, to MISS, to BACKEND_FETCH, to BACKEND_RESPONSE, to DELIVER. The VCL_return tags are responsible for this sequence of VCL subroutines being called.
When the request results in a cache hit, you’ll notice the following VCL tags in the VSL output:
*   << Request  >> 5
-   VCL_call       RECV
-   VCL_return     hash
-   VCL_call       HASH
-   VCL_return     lookup
-   VCL_call       HIT
-   VCL_return     deliver
-   VCL_call       DELIVER
-   VCL_return     deliver
There is no need to open up a << BeReq >> transaction and fetch data from the backend because the object can be served from cache.
The VCL_acl tag can contain the following information when an ACL wasn’t successfully matched:
- VCL_acl NO_MATCH purge
In this case an ACL named purge couldn’t match the IP address of the client.
The next example reflects a successful ACL match on the purge ACL for a client whose client.ip value could be matched to localhost:
- VCL_acl MATCH purge "localhost"
You can use std.log() in your VCL to log custom messages. Here’s some VCL that was used to log ACL mismatches with some extra information:
std.log(client.ip + " didn't match the 'purge' ACL");
This log line appears in VSL via a VCL_Log tag.
- VCL_Log 172.28.0.1 didn't match the 'purge' ACL.
And if you have multiple VCL configurations registered in Varnish, the VCL_use tag will remind you which ones were being executed.
Here’s the standard value for that tag:
--- VCL_use boot
If you didn’t register any extra VCL files, boot would be the one that was used when varnishd was booted.
When an error occurs within your VCL configuration, the VCL_Error tag is displayed, containing the error that occurred.
Here’s an example where too many levels of ESI were used:
-6- VCL_Error ESI depth limit reach (param max_esi_depth = 5)
The timestamp tag
The timestamp tag is very important, as it shows how long individual aspects of the HTTP request took.
Here’s the format of this tag:
%s: %f %f %f
|   |  |  |
|   |  |  +- Time since last timestamp
|   |  +---- Time since start of work unit
|   +------- Absolute time of event
+----------- Event label
Here’s an example of the timing for a typical request that resulted in a cache miss:
*   << Request  >> 11
-   Timestamp      Start: 1606398588.811189 0.000000 0.000000
-   Timestamp      Req: 1606398588.811189 0.000000 0.000000
-   Timestamp      Fetch: 1606398588.818399 0.007210 0.007210
-   Timestamp      Process: 1606398588.818432 0.007243 0.000032
-   Timestamp      Resp: 1606398588.818609 0.007421 0.000178
**  << BeReq    >> 12
--  Timestamp      Start: 1606398588.811381 0.000000 0.000000
--  Timestamp      Bereq: 1606398588.814423 0.003042 0.003042
--  Timestamp      Beresp: 1606398588.817982 0.006601 0.003559
--  Timestamp      BerespBody: 1606398588.818372 0.006991 0.000390
Different aspects of the execution flow are timed:
Start: when did the request start?Req: how long after the start did we receive the request?Fetch: in the case of a miss, how long did the fetch take?Process: how long did the processing of the backend response take?Resp: how long until we can return the response to the client that requested it?
The same applies to the << BeReq >> transaction:
Start: when did the backend request start?Bereq: how long after the start did we send out the backend request?Beresp: how long did it take for the backend response to arrive?BerespBody: how long until we processed the response body from the backend response?
The Unix timestamp in the second column gives you the exact time when each measurement took place with microsecond precision. However, we care more about the duration than the absolute time of execution.
The third column is the total time of execution since the start, and the fourth is the duration of this specific unit of work.
In our example it took the backend 72 milliseconds to respond, and it took Varnish a little over 74 milliseconds to return the response. But the individual task of returning the response to the client only took 178 microseconds.
For a cached object, the following logs could be generated:
*   << Request  >> 14
-   Timestamp      Start: 1606399284.176260 0.000000 0.000000
-   Timestamp      Req: 1606399284.176260 0.000000 0.000000
-   Timestamp      Process: 1606399284.176393 0.000133 0.000133
-   Timestamp      Resp: 1606399284.176648 0.000388 0.000255
Because this was a cache hit, there is no Fetch timestamp tag. There’s also no << BeReq >> transaction. The total execution time of the request is a mere 388 microseconds.
The TTL tag
- The TTL of a cached object can be set via HTTP headers.
- The TTL of a cached object can be overridden in VCL.
- The object might not be cacheable at all, which results in a hit-for-pass or hit-for-miss object.
All this information can be found in the TTL tag. Here’s its format:
%s %d %d %d %d [ %d %d %u %u ] %s
|  |  |  |  |    |  |  |  |    |
|  |  |  |  |    |  |  |  |    +- "cacheable" or "uncacheable"
|  |  |  |  |    |  |  |  +------ Max-Age from Cache-Control header
|  |  |  |  |    |  |  +--------- Expires header
|  |  |  |  |    |  +------------ Date header
|  |  |  |  |    +--------------- Age (incl Age: header value)
|  |  |  |  +-------------------- Reference time for TTL
|  |  |  +----------------------- Keep
|  |  +-------------------------- Grace
|  +----------------------------- TTL
+-------------------------------- "RFC", "VCL" or "HFP"
Let’s throw in a couple of examples to show the different values.
Here’s the first one:
-- TTL RFC 120 10 0 1606398419 1606398419 1606398419 0 0 cacheable
This object is cacheable and is stored in the cache for 120 seconds. Because it is cacheable, it is definitely not a HFP object. But because no Expires or Cache-Control header was set, Varnish will fall back on its default_ttl value, which is set at two minutes.
Also interesting to note is that ten seconds of grace was added but no extra keep time.
Here’s another cacheable response:
-- TTL RFC 25 10 0 1606400425 1606400425 1606400425 0 25 cacheable
The TTL for this example was set to 25 seconds, and that was because the max-age value of the Cache-Control header was set to 25.
Here’s an example of a hit-for-miss object being created after a Cache-Control: private, no-cache, no-store header was received:
-- TTL VCL 120 10 0 1606400537 uncacheable
For the next two minutes, all requests for this object will bypass the waiting list and will directly hit the backend. If in the meantime a cacheable response is returned, a regular object is inserted.
The more aggressive version of this is hit-for-pass. The following example is uncacheable for the same reasons but because return(pass(10s)); was added as an explicit return statement, the hit-for-miss is turned into a hit-for-pass:
-- TTL HFP 10 0 0 1606402666 uncacheable
The TTL value is ten seconds because of the fact that this duration was explicitly used in return(pass(10s));.
In the final TTL example, we’ll juice up grace and keep a bit:
-- TTL RFC 500 500 86400 1606403184 1606403184 1606403183 0 500 cacheable
The Cache-Control header had a max-age value of 500 seconds; we set the grace to an hour, and the keep to a day.
The fact that we set the TTL via an HTTP header, turned this into an RFC log item.
Output filtering
Now that we’ve familiarized ourselves with the various VSL tags, it’s time to put these tags to use.
If you run varnishlog on a production server, you’ll be overwhelmed by the amount of output coming your way. By filtering out specific tags, the information is easier to process.
Tag inclusion
The -i parameter in varnishlog will only include the tags that were mentioned.
Here’s a standard example, where we want to know the URL of a request and its flow through the finite state machine:
varnishlog -i ReqUrl,VCL_call,VCL_return -g session
This example will only include the ReqUrl, VCL_call, and VCL_return tags for transactions that were grouped by session:
*   << Session  >> 1
**  << Request  >> 2
--  ReqURL         /
--  VCL_call       RECV
--  VCL_return     hash
--  VCL_call       HASH
--  VCL_return     lookup
--  VCL_call       MISS
--  VCL_return     fetch
--  VCL_call       DELIVER
--  VCL_return     deliver
*** << BeReq    >> 3
--- VCL_call       BACKEND_FETCH
--- VCL_return     fetch
--- VCL_call       BACKEND_RESPONSE
--- VCL_return     deliver
As you can see, the homepage was consulted but was not served from cache. A backend fetch was required.
A very common example, and thanks to output filtering, the logs are easier to interpret.
Wildcards are also supported. Our previous example can even be rewritten as follows:
varnishlog -i "ReqUrl,VCL_*" -g session
Tag exclusion
You can also exclude tags from the output. This is done by using the -x parameter.
Here’s an example where we include all tags that start with Req, but we want to exclude the ReqHeader and ReqUnset tags:
varnishlog -i "Req*" -x ReqHeader,ReqUnset
And here’s the output:
-   ReqStart       172.28.0.1 52280 http
-   ReqMethod      GET
-   ReqURL         /
-   ReqProtocol    HTTP/1.1
-   ReqAcct        140 0 140 294 608 902
Tag inclusion by regular expression
Basic tag inclusion and exclusion is already a step in the right direction. But some tags have many occurrences in a single transaction.
Take for example a request where you only care about the Accept-Language header. Including ReqHeader will include all the headers, even the once you don’t need.
The solution is to filter out tags by value. The -I uppercase parameter does just that.
The following example retrieves the URL of the request and the Accept-Language header:
varnishlog -g request -i ReqUrl -I ReqHeader:Accept-Language
Here’s the output for the next request:
-   ReqURL         /
-   ReqHeader      Accept-Language: en-US,en;q=0.9,nl;q=0.8,nl-NL;q=0.7
If it weren’t for the -I parameter, you’d get a lot more irrelevant output, even if you use -i.
Tag exclusion by regular expression
Whereas -I includes tags by matching the value, the same thing can be done for exclusion. The -X uppercase parameter can be used to exclude tags based on a regular expression.
Here’s an example where we include the ReqUrl and RespHeader tags, but we exclude all response headers that start with an X, both uppercase and lowercase:
varnishlog -g request -i ReqUrl -i RespHeader -X "RespHeader:(X|x)-"
Here’s the output for the next request:
*   << Request  >> 5
-   ReqURL         /
-   RespHeader     Content-Type: application/json; charset=utf-8
-   RespHeader     Content-Length: 539
-   RespHeader     ETag: W/"21b-faj3J9Bg0wmX965fRcvtQFqPZr4"
-   RespHeader     Date: Fri, 27 Nov 2020 09:19:48 GMT
-   RespHeader     Age: 99
-   RespHeader     Accept-Ranges: bytes
-   RespHeader     Connection: keep-alive
The X-Varnish response header is removed from this transaction, possibly along with some other headers that were sent by the origin that started with an X.
Filtering by request type
Unless the -c or -b flags were added to varnishlog, both << Request >> and << BeReq >> transactions are included in the output.
However, you can filter out entire transactions:
- If you only care about the client-side request, you can use the
-cparameter. - If you only care about the backend request, you can use the
-bparameter.
The following example will list both the URL that was provided by the client, and the URL that was sent to the origin. However, the -c flag will prevent the << BeReq >> transaction from being included in the output:
varnishlog -g request -c -i ReqUrl -i BereqUrl
Here’s the output:
*   << Request  >> 12
-   ReqURL         /
The all-in-one example
Let’s end the output filtering subsection with an all-in-one example that uses all filtering techniques.
Here’s the varnishlog command:
varnishlog -c -g request -i Req* -i Resp* \
	-I Timestamp:Resp -x ReqAcct -x RespUnset \
	-X "RespHeader:x-debug"
The RespUnset tag reports response tags being removed. There’s also an x-debug header in play. We don’t want our VSL output to be polluted with this kind of information, hence the -x RespUnset and -X "RespHeader:x-debug" parameters.
With that in mind, here’s the output:
*   << Request  >> 1
-   ReqStart       172.18.0.1 38076 http
-   ReqMethod      GET
-   ReqURL         /
-   ReqProtocol    HTTP/1.1
-   ReqHeader      Host: localhost
-   ReqHeader      User-Agent: curl/7.64.1
-   ReqHeader      Accept: */*
-   ReqHeader      X-Forwarded-For: 172.18.0.1
-   RespProtocol   HTTP/1.1
-   RespStatus     200
-   RespReason     OK
-   RespHeader     Content-Type: application/json; charset=utf-8
-   RespHeader     Content-Length: 555
-   RespHeader     ETag: W/"22b-nCrko0g3BQi5EC4Z9AcxPigbGms"
-   RespHeader     Date: Fri, 27 Nov 2020 09:40:46 GMT
-   RespHeader     X-Varnish: 65543
-   RespHeader     Age: 100
-   RespHeader     Via: 1.1 varnish (Varnish/6.0)
-   RespHeader     Accept-Ranges: bytes
-   RespHeader     Connection: keep-alive
-   Timestamp      Resp: 1606470046.159483 0.003742 0.000081
VSL queries
So far we’ve been filtering output and have only been displaying the tags we care about. This definitely decreases the amount of log lines in the output.
But there’s still the potential for noise. Although we’ve been reducing the size of the transactions, we’re still displaying all transactions.
In this section we’re going to apply VSL queries to only include transactions that match specific criteria.
The -q parameter will allow us to specify a query. The syntax for VSL queries goes as follows:
<record selection criteria> <operator> <operand>
Yes, this is quite vague. An example will make this make more sense. Here it is:
varnishlog -i VCL_call -i VCL_return -q "ReqUrl eq '/'"
This varnishlog command will display the VCL flow by including VCL_call and VCL_return tags, but only for the homepage, that is, only when the ReqUrl tag is equal to /.
If we refer back to the VSL query syntax, we can break this down as follows:
ReqUrlis part of the record selection criteria.eqis the operator.'/'is the operand.
Record selection criteria
The record selection criteria can be a lot more elaborate than what we just showed you. Here’s the syntax for these criteria:
{level}taglist:record-prefix[field]
The {level} syntax refers to the transaction hierarchy in VSL. Here’s a diagram that clarifies these levels:
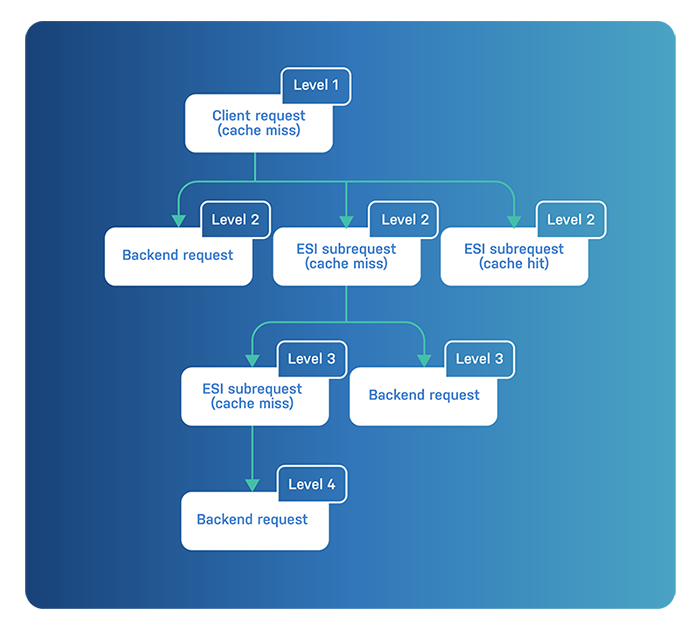
These levels only apply when request grouping takes place. And the level 1 transaction is the client request.
When a cache miss takes place, a level 2 transaction appears in the logs. This contains a backend request, but at the same time can also contain a set of ESI subrequests.
In the diagram, we’ve made a distinction between ESI subrequests that resulted in a cache hit or a cache miss.
For ESI subrequests that cause a cache miss, a level 3 backend request is required. Maybe that ESI subrequest triggers another ESI subrequest.
If that level 3 ESI subrequest also results in a cache miss, a level 4 backend request is triggered.
This can go on and on until you hit the max_esi_depth limit. The default value for the max_esi_depth runtime parameter is currently five.
The taglist directive refers to one tag or a glob pattern that matches multiple tags.
If a transaction has multiple occurrences of a tag, the record-prefix can be used to single out log lines that match the prefix.
And if you want to match specific values from individual fields in a log line, the [field] syntax can be used.
This is a lot of information to digest. Let’s throw in an example that uses the full syntax:
varnishlog -c -i ReqUrl -I Timestamp:Resp -g request -q "{2+}Time*:Resp[2] > 2.0"
This example will only display transactions that have subtransactions. The number of levels doesn’t matter as long as it is more than two.
For these transactions, only the client-side transaction is shown, and only the request URL and timestamp are displayed for responses that took longer than two seconds to generate.
Let’s break down the query:
{2+}: the query applies to transactions at level 2 or greaterTime*: a glob pattern that matches all tags that start withTime:Resp: refers to prefixes of log lines that matchRespfor these tags[2]: looks at the second field of a matched log line> 2.0: ensures that value is greater than two
And let’s have a look at parameters as well:
-c: only displays client-side transactions-i ReqUrl: displays the URL of the request-I Timestamp:Resp: displaysTimestamptags that have aRespprefix-g request: groups the transactions by request-q: performs a VSL query, and only displays transactions that match the query
This could be the output of the varnishlog command:
*   << Request  >> 13
-   ReqURL         /
-   Timestamp      Resp: 1606733707.261102 3.012484 3.007354
**  << Request  >> 15
--  ReqURL         /esi
--  ReqURL         /esi
--  Timestamp      Resp: 1606733707.260886 3.006929 0.000161
As we can see, the / page takes more than three seconds to load and that is because the /esi subrequest took so long to load.
Operators
We’ve already seen some VSL query examples that feature both string comparisons and numerical comparisons.
For the sake of completeness, here’s a list of the operators that are supported by the VSL query syntax:
==: the operand numerically equals the record value!=: the operand doesn’t numerically equal the record value<: the operand is greater than the record value<=: the operand is greater than or equal to the record value>: the operand is less than the record value>=: the operand is less than or equal to the record valueeq: the operand equals the record string valuene: the operand doesn’t equal the record string value~: the record value matches the regular expression pattern!~: the record value doesn’t match the regular expression pattern
Operands
We’ve already covered the record selection criteria, and we listed the operators. We just need to talk about operands, which is very straightforward.
There are four types of operands:
- Integers
- Floating point numbers
- Strings
- Regular expressions
Let’s have an example for each operand type. Here’s the one for the integer type:
varnishlog -g request -q "BerespStatus >= 500"
This example will only show transactions whose status code is greater than or equal to 500. This implies retrieving server errors.
Here’s the float example:
varnishlog -g request -q "Timestamp:Resp[2] > 2.0"
This example command looks familiar and was already featured. Just remember that the timestamps have microsecond precision and are expressed as floating point numbers.
The string example is also quite simple:
varnishlog -g request -q "ReqUrl eq '/'"
This example will only show transactions for the homepage.
And here’s the regular expression example:
varnishlog -g request -q "ReqUrl ~ '^/contact'"
This example will match all transactions that start with /contact. This also includes requests for a URL like /contact-page.
You may wonder why booleans aren’t included in the list of types. This is because transactions don’t have boolean values. However, boolean comparisons are supported.
Here’s an example of a boolean comparison:
varnishlog -g request -q "ReqHeader:Accept-Language"
This query will include all transactions that have an Accept-Language request header. The exact opposite is also supported by adding the not keyword:
varnishlog -g request -q "not ReqHeader:Accept-Language"
This example will include all transactions that do not have an Accept-Language request header.
Chaining queries
All the VSL query examples we’ve featured so far used a single comparison.
Multiple comparisons are supported, and queries can be chained using the and boolean function, or the or boolean function.
Here’s an example that combines two comparisons:
varnishlog -c -i ReqUrl -I RespHeader:Content-Type \
    -i reqacct -g request \
    -q "RespHeader:Content-Type ~ '^image/' and ReqAcct[5] >= 2000000"
This example will display the URL, Content-Type header, and request handling byte counts for all transactions where the Content-Type response header matches the ^image/ pattern, and the number of bytes returned by the body is greater than 2 MB.
Here’s the potential output:
*   << Request  >> 65562
-   ReqURL         /image.jpg
-   RespHeader     Content-Type: image/jpeg
-   ReqAcct        82 0 82 311 2832889 2833200
The Content-Type header is image/jpeg, which matches the regular expression. And also the fifth field of the ReqAcct tag is 2832889, which is more than 2 MB. The combination of these two comparisons results in the output.
Here’s an example where the or boolean function is used to chain comparisons:
varnishlog -c -g request -i ReqUrl \
    -I VCL_call:PASS -I VCL_call:MISS \
    -q "VCL_call eq 'MISS' or VCL_call eq 'PASS'"
This example will show the URL and MISS/PASS status for all requests that are cache misses, or where the cache is bypassed.
Here’s the potential output for such a query:
*   << Request  >> 10
-   ReqURL         /
-   VCL_call       MISS
*   << Request  >> 525
-   ReqURL         /account
-   VCL_call       PASS
And finally, parentheses can be used when and and or are combined. Here’s an example where we use parentheses for this:
varnishlog -c -g request -i ReqUrl
    -q "TTL[6] eq 'uncacheable' and
	    (BerespHeader:Set-Cookie or
   		 BerespHeader:Cache-Control ~ '(private|no-cache|no-store)')"
This example will display the URL of the corresponding request for uncacheable responses that were caused by the presence of a Set-Cookie response header, or the fact that the Cache-Control response header contained non-cacheable directives.
Rate limiting
VSL is extremely verbose. Running a tool like varnishlog on a production server will become somewhat overwhelming.
Tag filtering and using VSL queries to reduce the output will only get you so far. On busy systems where a lot of transactions meet the querying criteria, there will still be tons of output.
If you don’t need every single log line to get the required insight, you can opt to use rate limiting.
The -R uppercase parameter will limit the number of transactions that are returned based on a ratio.
Here’s an example where only ten transactions per minute are displayed:
varnishlog -g request -R 10/1m
The format of -R is <number-of-requests>/<duration>. The duration is expressed as a VCL duration type. This includes the numerical value and the time unit suffix.
Dumping the buffer
When VSL programs are run, input is collected from the moment the program is started. However, there is already a lot more information in the VSL circular buffer.
By adding the -d option to varnishlog, the output starts at the head of the log and exits.
The -d option is useful for getting the full picture. The size of the VSL space is controlled by the -l option for varnishd, and as stated previously the default size is 80 MB. The bigger you set this, the more information is held in this buffer.
Here’s an example where you get the URL and starting timestamp for all transactions in the VSL buffer that started at 08/10/2023 13:00:00 UTC or later:
varnishlog -g request -i requrl -d \
    -q "Timestamp:Start[1] >= $(date -d '08/10/2023 13:00:00' +%s.0)"
The $(date -d '08/10/2023 13:00:00' +%s.0) subcommand was used to convert the date and time into the Unix timestamp format that is used by the Timestamp tag.
Documentation
Fore more information about the varnishlog program and VSL, you can consult the official documentation on varnish-cache.org.